Finding Best-Selling Products in a Period
The following will walk through how to use the Sales Analysis feature to find the best-selling products in a certain period.
STEP 1
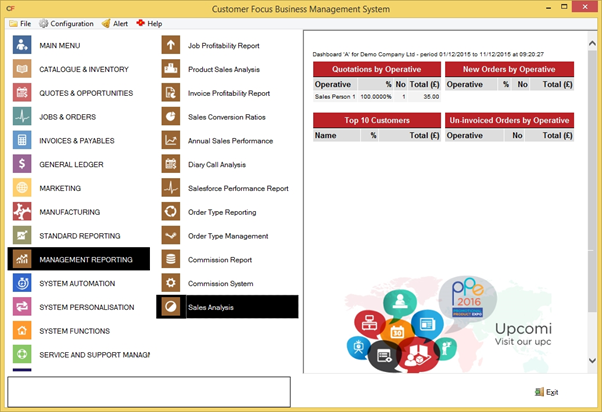
To begin, go to ‘Management Reporting’ from the main menu, followed by ‘Sales Analysis’.
NOTE: If you cannot see the ‘Management Reporting’ on the leftmost panel you may have to log in as an elevated user. Consult your admin department if you do not currently have access.

STEP 2
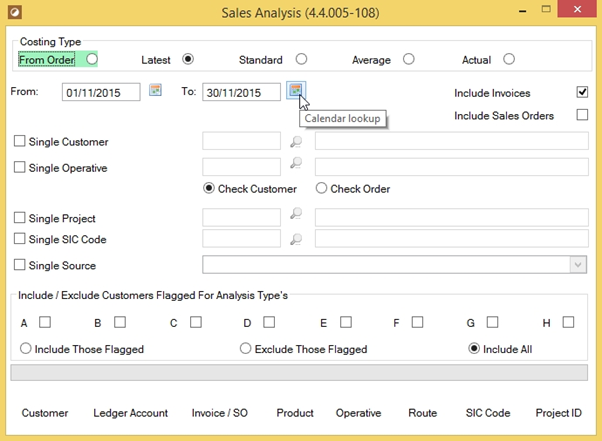
The Sales Analysis window will appear. This is where you can define specifically what data you want to analyse. Firstly, note the date ranges below the Costing type radio buttons. This is the period you will be running the analysis for, and can use the calendar icons to display a small pop-out calendar for ease of selection.
You can also define specific criteria for the analysis, such as only analysing data relating to a single customer, operative, project, SIC code or source.

STEP 3
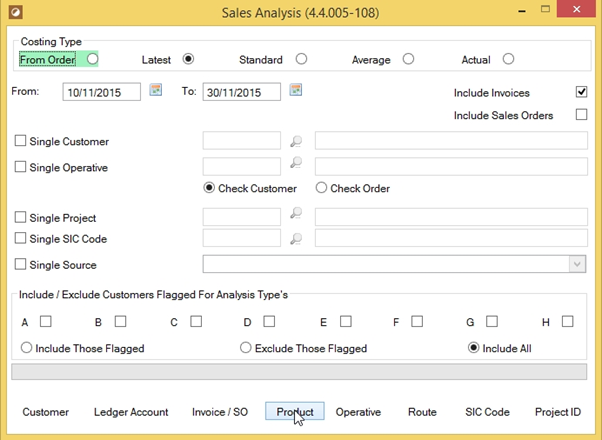
Once you’re happy with the criteria you’ve set, click the ‘Product’ button on the bottom row of the screen to generate the analysis results screen.

STEP 4
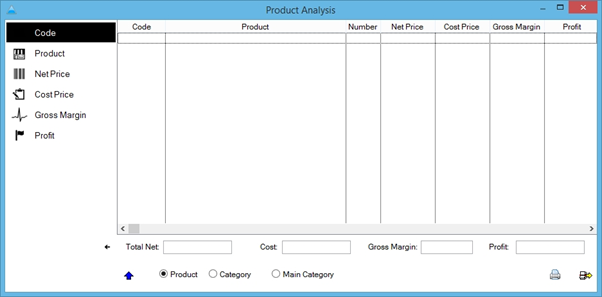
The results of your analysis will now be displayed. The information on this screen can be sorted by the tabs on the left side of the screen for easier digestion. For example, if you wanted to find which product generated the most profit during a period, click the ‘Profit’ tab to sort the data in ascending profit order.


